
We diagnose conversion leaks, formulate data-backed UX hypotheses, and deploy statistically rigorous A/B experiments that permanently increase your revenue per visitor, lower customer acquisition costs, and scale your digital pipeline.
Most digital businesses bleed thousands of dollars every week not because of low traffic, but because of silent usability friction, broken psychological queues, and untested assumptions in their conversion funnels.
Ad platforms are more expensive each year. Pouring more ad spend into a landing page that converts at only 1.2% burns cash. Without CRO, your unit economics eventually become completely upside down.
Every unnecessary input field, ambiguous price breakdown, or unexpected shipping fee triggers cognitive anxiety. Buyers hesitate, open a competitor tab, and abandon their carts forever.
While 70%+ of traffic arrives on smartphones, desktop conversion is often 3x higher. Tiny tap targets, keyboard layout conflicts, and sluggish viewport rendering destroy mobile conversion momentum.
Visitors cannot answer within 5 seconds: "What is this, who is it for, and why should I trust you over alternatives?" Generic corporate jargon and weak headlines confuse first-time buyers.
Companies invest $50k+ in subjective visual overhauls based on executive preferences instead of empirical visitor behavior — only to watch conversion rates plummet right after launch.
Default Google Analytics setups only capture generic page views, without custom event tracking on CTA clicks, form error states, micro-conversions, or cohort scroll depths. You cannot fix what you cannot measure.
We do not guess. We combine deep quantitative data mining with empathetic qualitative psychology to uncover precisely where, why, and how users abandon your pages.
Tells us WHAT is happening and WHERE visitors drop off with statistical precision.
Tells us WHY visitors behave the way they do and what emotional hurdles stop them.
Every experiment starts with a verifiable hypothesis scored against proven frameworks like ICE (Impact, Confidence, Ease). We test high-yield leverage points first to deliver compounding ROI from day one.
Pin primary CTA & Apple Pay button to bottom viewport on mobile devices to bypass scroll friction.
Display real-time verification badge: "12 teams booked an audit in the last 24h" next to primary button.
Split overwhelming 8-field form into a frictionless 2-step wizard with email validation on step 1.
Allow prospective enterprise clients to slide their traffic volume to dynamically calculate estimated revenue upside.
We build dedicated conversion landing pages designed from the ground up around persuasive design psychology, 1:1 attention ratios, and lightning-fast sub-second load speeds.
We eliminate extraneous top navigation links, sidebars, and distracting exit paths. There is only one singular, uncompromising action for the visitor to take on the page.
The exact keywords, pain points, and creative promises from your Google Ads, Meta campaigns, or LinkedIn creatives are mirrored directly in the hero headline for zero bounce cognitive ease.
We position high-impact social proof exactly where doubt arises: client logos in the hero, verified outcome stats above the fold, and micro-testimonials right beside CTA buttons.
Smart form autocompletion, progressive profiling, one-click Google/Apple authentication, and clear field validation indicators turn dreaded form fills into effortless 15-second actions.
Every 100ms latency cuts conversion by up to 7%. Our landing pages load in under 600ms worldwide via edge caching, zero heavy script bloat, and modern next-gen asset optimization.
We systematically address customer fears directly alongside the purchase trigger: clear money-back guarantees, explicit cancel-anytime terms, and transparent implementation roadmaps.
False positives kill businesses. We adhere to mathematically sound testing methodologies: proper sample size calculation, pre-test power analysis, and 95%+ Bayesian confidence before declaring any winner.
Testing an isolated variable against the baseline control (e.g. value headline, pricing structure, or CTA hierarchy) to measure direct cause-and-effect with absolute certainty.
For stores and SaaS apps with 100k+ monthly visitors, we test multiple interactive components simultaneously to calculate exact cross-combination synergies and compound uplifts.
No ugly client-side DOM flickering or delayed script execution. Tests render directly at the Cloudflare edge or server layer for 100% Core Web Vitals integrity and zero latency impact.
We replace messy tracking with an enterprise event taxonomy. Every meaningful click, scroll depth, form interaction, error message, and purchase milestone is captured cleanly with first-party attribution.
Track custom parameters: form_field_abandoned, cta_variant_engaged, video_50pct_watched, tier_toggle_selected, and discount_applied.
Bypass ad-blockers and iOS privacy restrictions with server-side Google Tag Manager (sGTM) and Meta Conversions API (CAPI) for 99%+ tracking fidelity.
Analyze conversion velocity across different device types, traffic channels, geographies, and return visitors to ensure test wins hold true across all segments.
Optimization is not a one-and-done project; it is an iterative compounding flywheel. Consistent monthly wins of 8-12% compound into 2x to 3x annual revenue growth without touching ad spend.
Every 14 days we review concluded test telemetry, celebrate winners, dissect neutral results, and deploy the next high-priority ICE test.
No vanity charts. Our automated client dashboard reports pure commercial impact: Added Monthly Recurring Revenue, CVR percentage gains, and CAC reductions.
Every experiment is archived in your team’s custom CRO repository with screenshots, hypothesis logs, statistical graphs, and customer psychology takeaways.
* Based on a digital business receiving 50,000 monthly visits with an average order/contract value of $250.
We build high-performance digital products and platforms that drive real commercial results.
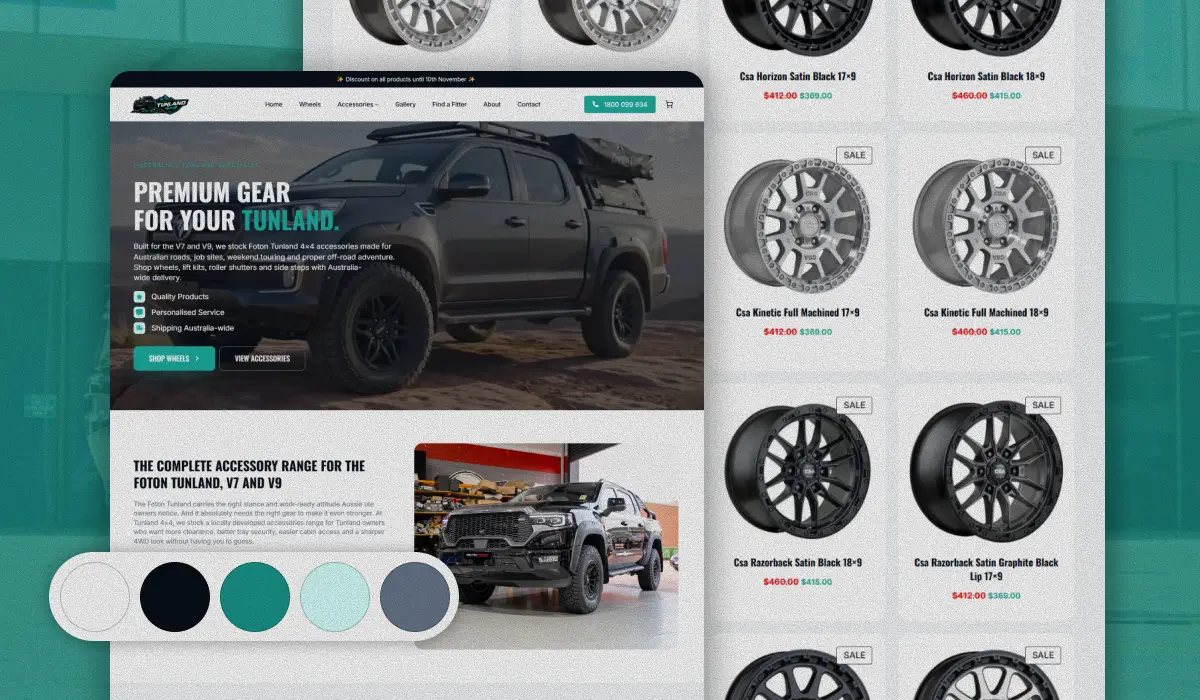
Dedicated 4WD e-commerce platform for Foton Tunland utes built from scratch on WordPress with model-specific fitment verification, dynamic suspension catalogs, and sub-second speed.
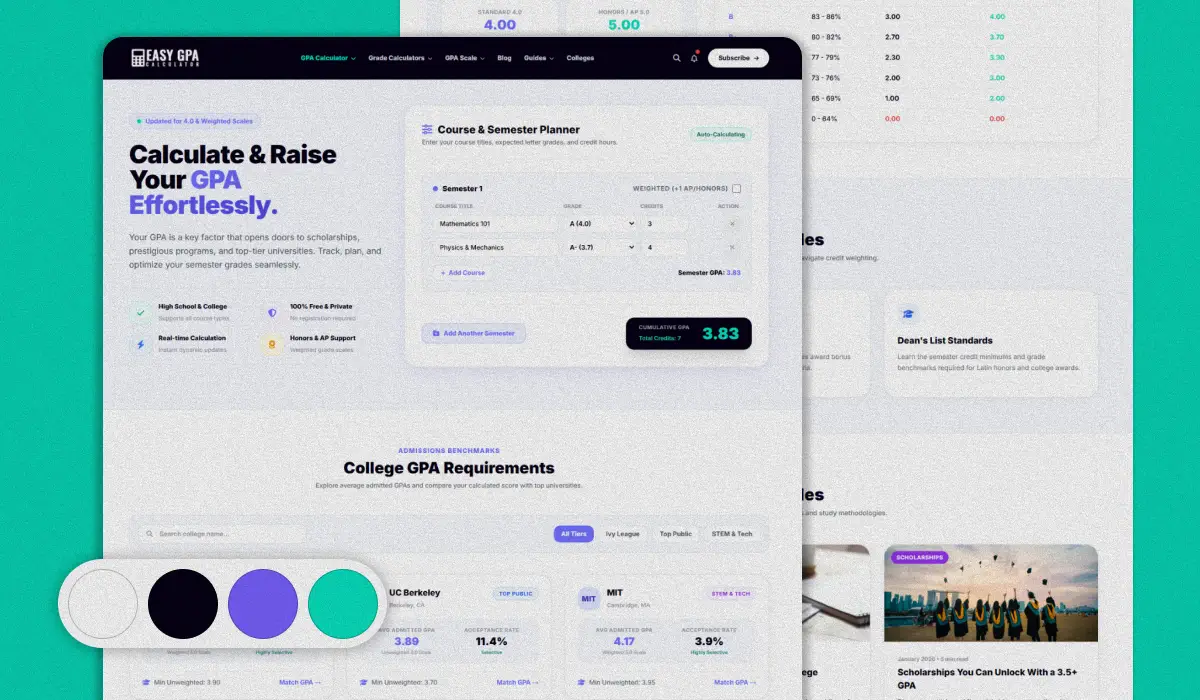
Startup calculation tool and college guide platform for students, re-engineered on WordPress with an in-memory computation engine and full programmatic SEO architecture.
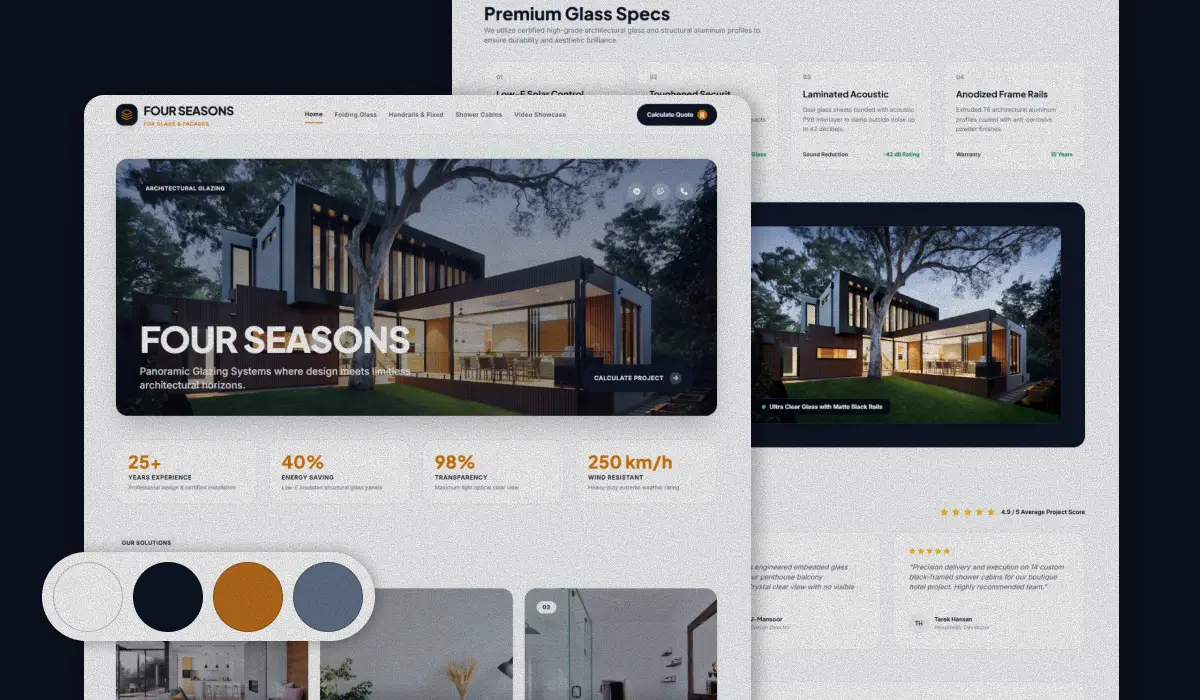
Bespoke custom WordPress platform engineered from scratch for Egypt’s premier architectural glazing fabricator, featuring next-gen WebP portfolio galleries and localized regional SEO.
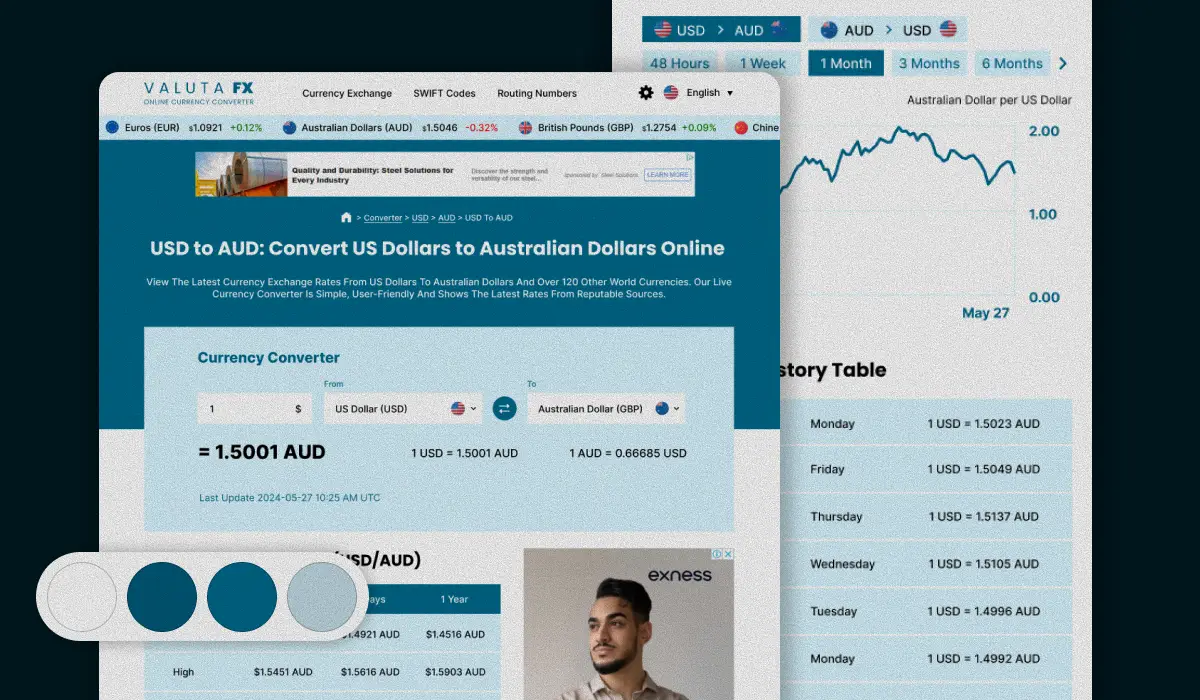
End-to-end UI/UX redesign and logo modernization for a high-traffic global currency converter, engineered with high-contrast fintech components and streamlined conversion flow.
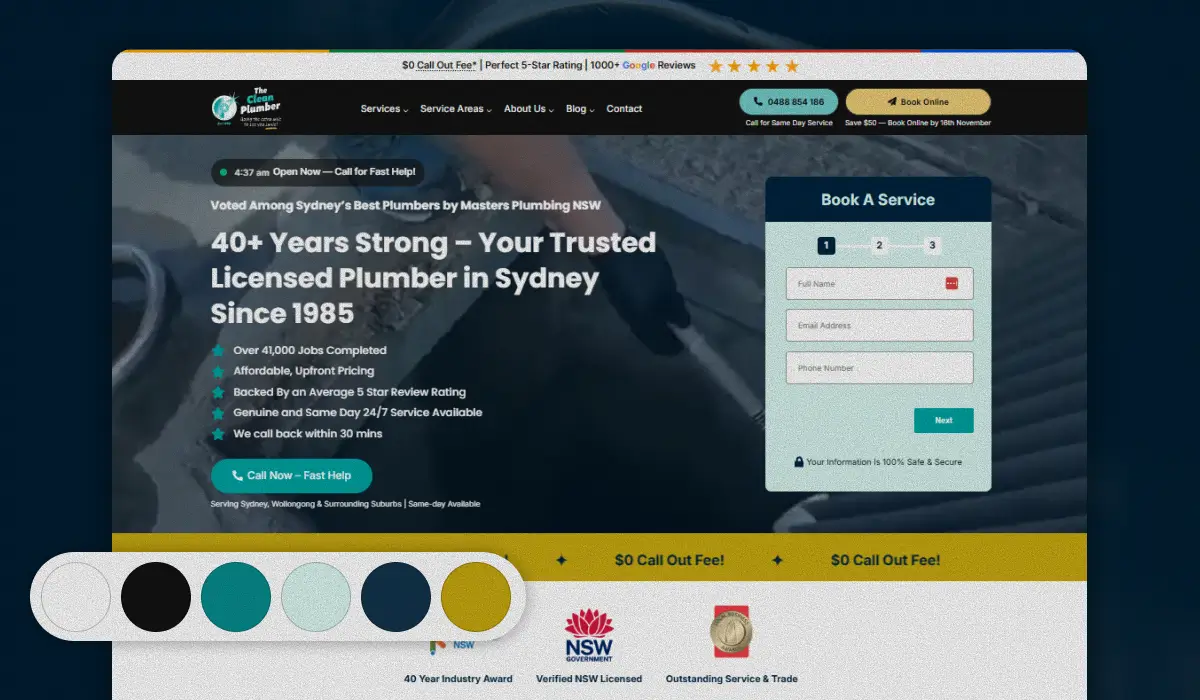
Full digital redesign for Sydney and Illawarra's premier plumbing specialists, engineered for sub-second mobile speed, friction-free booking forms, and high-converting local outreach.
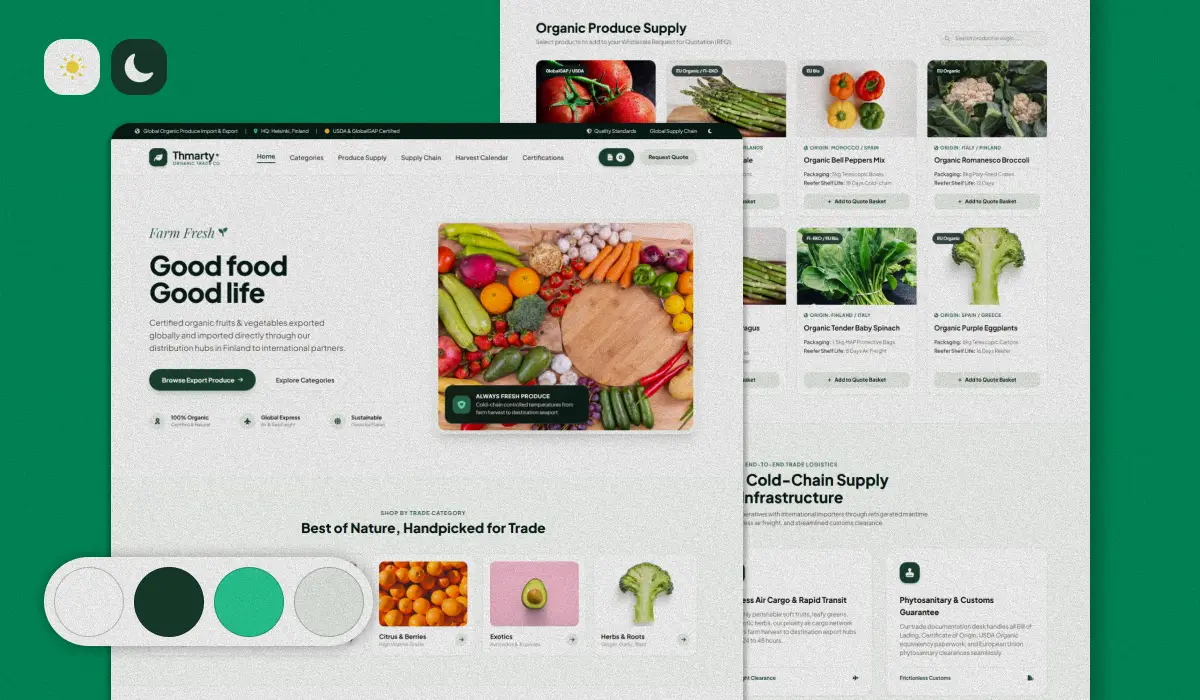
High-performance international trading portal for certified organic vegetables and fruits, featuring wholesale container specifications, EU compliance certifications, and automated B2B RFQs.
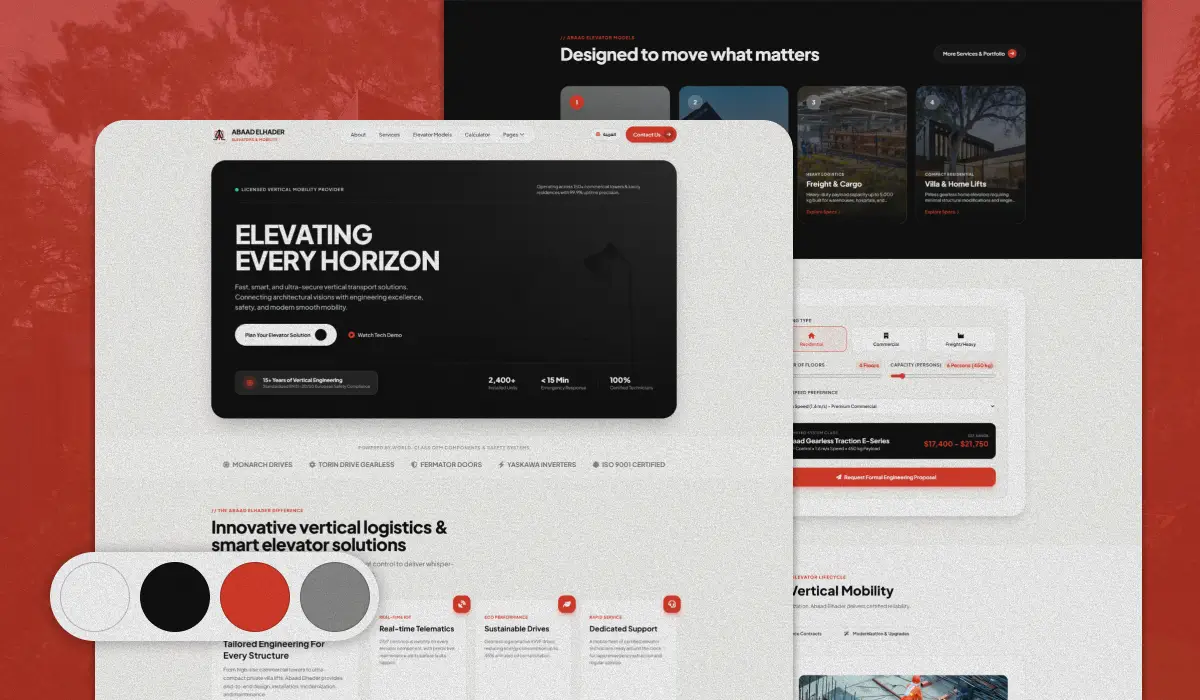
Modern corporate digital presence for an architectural elevator and mobility engineering leader, featuring interactive lift configurators, technical specifications, and luxury project showcases.
Trusted by clients who value quality and results.

"The Tunland 4x4 website has already made its first sale! We're so happy with the results. Thank you for all your help and support. Alaa did an amazing job bringing the vision and direction to life."


"Working with Code1001 made a huge difference for my clinic. The website is clean, loads fast, and patients find it very easy to book their sessions online. Alaa really listened to what we needed and delivered ahead of schedule."

"We're getting a lot of compliments on the new website, and we already received several quote requests through WhatsApp in the first week. Alaa was super helpful, patient, and delivered exactly what we asked for. Thank you so much!"

"Managing my student groups and teaching schedule used to take up hours of paperwork every week. Abdelrahman from the Code1001 team built a custom app that organized everything—classes, timings, and student tracking—in one simple place. It made my daily work so much easier. Thank you so much Abdelrahman and the Code1001 team!"

"Code1001 helped us take Step Up Academy to the next level. They created beautiful designs for our brand and automated our student registrations and daily follow-ups. What used to take hours of manual work every day now runs smoothly. Thank you so much for the wonderful work and continuous support!"
Everything you need to know about our experimentation methodology, traffic requirements, tooling, and expected return on investment.
For traditional A/B testing with 95% statistical significance, we generally recommend at least 15,000 to 25,000 monthly unique visitors and 200+ monthly conversions. However, if your traffic is lower, we deploy high-velocity qualitative heuristics, usability friction teardowns, and user session replay audits that drive significant conversion gains without needing massive statistical sample sizes.
Our comprehensive research and forensic audit phase takes 2 weeks. The first high-impact experiment cycle goes live by week 3. Most clients achieve their first verified winning variant within 30 to 45 days, typically recovering their full program investment within the first quarter.
No. As performance engineers, we strictly avoid bloated client-side testing scripts that cause jarring flash-of-unoriginal-content (FOOC). We deploy experiments using server-side edge routing (Cloudflare Workers / Next.js Edge) or asynchronous lightweight testing engines with zero latency and zero Core Web Vitals penalty.
We work natively across leading enterprise experimentation platforms including VWO, Optimizely, Convert.com, PostHog, LaunchDarkly, and custom headless split testing engines. On the analytics side, we integrate deeply with GA4, Mixpanel, Segment, Hotjar, and Microsoft Clarity.
In empirical CRO, there are no wasted tests. A flat test prevents you from rolling out a costly, ineffective redesign that could have crippled sales. More importantly, every test generates valuable qualitative feedback on user hesitation, which directly informs and refines the next winning hypothesis in our prioritized ICE backlog.
No, Code1001 provides end-to-end full-stack execution. Our team writes the research briefs, designs the high-fidelity UI variants in Figma, codes the test variants, sets up the tracking tags, and permanently pushes winning code into your production codebase upon conclusion.
Send us your website or funnel URL. Within 48 hours, our senior CRO engineers will deliver a recorded 15-minute video teardown revealing the top 3 friction points costing you sales right now.