
We diagnose performance bottlenecks, eliminate technical debt, and engineer sub-second load times — turning slow, penalized websites into competitive, revenue-generating machines that rank higher and convert better.
Before we optimize a single line of code, we run a forensic performance audit using real-user monitoring, synthetic lab tests, and server-level profiling to map every millisecond of wasted load time.
We run Lighthouse, WebPageTest, and GTmetrix audits from global locations to establish baseline load times across mobile and desktop under real network conditions.
We inspect PHP execution times, MySQL query loads, server response headers, and memory consumption to identify backend processing bottlenecks causing slow initial response.
Chrome DevTools performance traces identify render-blocking scripts, long JavaScript tasks, unused code coverage, and main thread saturation slowing your Time to Interactive.
Full audit of uncompressed images, outdated formats (JPEG/PNG vs WebP/AVIF), non-lazy-loaded media, third-party script payloads, and unused CSS rules adding dead weight.
Google's Core Web Vitals directly impact rankings and user experience. We don't just hit passing thresholds — we engineer each metric to exceptional levels that outperform your competitors.
The time for the main hero image or text block to fully paint on screen. Slow LCP means users stare at a blank or partial page — killing first impressions and bounce rate.
Google replaced FID with INP in 2024. INP measures how quickly the entire page responds after any interaction — click, tap, or keypress. High INP feels laggy and broken.
CLS measures visual instability — how much page elements unexpectedly jump as the page loads. Layout shifts are jarring for users and are penalized by Google's ranking algorithm.
Most slow websites share the same root causes: bloated plugins, unoptimized databases, render-blocking resources, and misconfigured servers. We systematically eliminate all of them.
We audit every active plugin for performance cost — removing redundant ones, replacing heavy plugins with lightweight custom code, and eliminating conflicting JS/CSS loads.
Bloated wp_options tables, N+1 query loops, missing indexes, and transient storage misuse add hundreds of milliseconds. We profile and rebuild your database access patterns.
Scripts and stylesheets that block the initial page render are deferred, async-loaded, or inlined where critical. We implement proper resource hint chains (preload, prefetch, preconnect).
We configure PHP-FPM worker pools, OPcache settings, and memory limits for peak throughput. Nginx or Apache server blocks are hardened for fast static file delivery.
Analytics, live chat, heatmaps, and marketing scripts can add 1-3 seconds of load time. We audit, consolidate, and lazy-load third-party tags using Google Tag Manager with performance constraints.
We extract only the CSS required to render above-the-fold content, inline it in the HTML document head, and defer the full stylesheet — eliminating render-blocking CSS completely.
Unoptimized images alone can account for 60–80% of a page's total weight. We convert, compress, and intelligently deliver every asset to eliminate wasted bytes without sacrificing visual quality.
Every JPEG, PNG, and GIF is converted to WebP with AVIF fallbacks, delivering identical quality at 30–70% smaller file sizes.
We implement proper srcset and sizes attributes so browsers download only the image resolution required for each screen size, eliminating oversized asset downloads.
Below-fold images are lazy-loaded via native browser APIs. All assets are served from global CDN edge nodes with far-future cache headers and automatic cache purging on updates.
Speed is not just about code quality — it is about architecture. We implement a multi-layered caching strategy that serves cached content from the edge before requests even reach your origin server.
Far-future Expires headers and immutable Cache-Control directives ensure returning visitors load your site instantly from their local disk cache with zero network requests.
Cloudflare Enterprise or equivalent CDN caches full HTML pages, CSS, JS, and assets at 300+ global Points of Presence — serving content from the nearest edge node to each visitor.
Redis in-memory object caching stores expensive database query results, keeping PHP execution times under 10ms even for complex database-driven pages with thousands of concurrent users.
Static HTML copies of dynamic pages are stored on disk and served directly by Nginx, completely bypassing PHP and MySQL for logged-out users — achieving static-site speed for WordPress.
Legacy code bloat, page-builder overhead, and architectural mismatches are invisible performance killers. We refactor critical rendering paths and modernize frontend architecture for measurable speed gains.
We analyze your JS dependency graph, remove unused modules, split large bundles into route-level chunks, and implement dynamic imports so browsers only load what each page actually needs.
Elementor, Divi, and WPBakery add 500KB–2MB of CSS/JS bloat per page. We extract your layouts into clean custom PHP templates and vanilla CSS, eliminating page builder overhead entirely.
We implement HTTP/2 server push for critical resources, preconnect to third-party origins, and configure preload chains for fonts and hero images to eliminate waterfall bottlenecks.
We self-host web fonts with font-display:swap, subset characters to only used glyphs, preload critical font faces, and eliminate Flash of Invisible or Unstyled Text (FOIT/FOUT).
Performance isn't a one-time fix. New content, plugin updates, and traffic spikes degrade speed. We set up continuous monitoring dashboards so you always know your site's real-world performance.
Lightweight analytics measure actual user experience across browsers, devices, and connection types — providing field data alongside synthetic lab tests for complete performance truth.
Automated Lighthouse audits run daily from global locations to detect regressions before they impact users or rankings. Reports are delivered to your dashboard and Slack channel.
Instant alerts whenever any Core Web Vital degrades below our established baseline threshold. Our engineering team investigates and patches regressions within 24 hours.
Clear, executive-level monthly performance reports with trend graphs, Core Web Vitals history, and actionable optimization recommendations for content and engineering teams.
Performance optimization is not just a technical exercise — it is a direct revenue multiplier. Every 100ms reduction in load time produces a measurable lift in conversion rate, session depth, and organic rankings.
WooCommerce store with 8,000+ SKUs suffering from a Lighthouse score of 28 and 6.4s average mobile load time.
"Our mobile conversion rate jumped from 1.4% to 4.1% within two weeks of the performance sprint. The ROI was immediately visible in our revenue dashboard."
We build high-performance digital products and platforms that drive real commercial results.
Dedicated 4WD e-commerce platform for Foton Tunland utes built from scratch on WordPress with model-specific fitment verification, dynamic suspension catalogs, and sub-second speed.
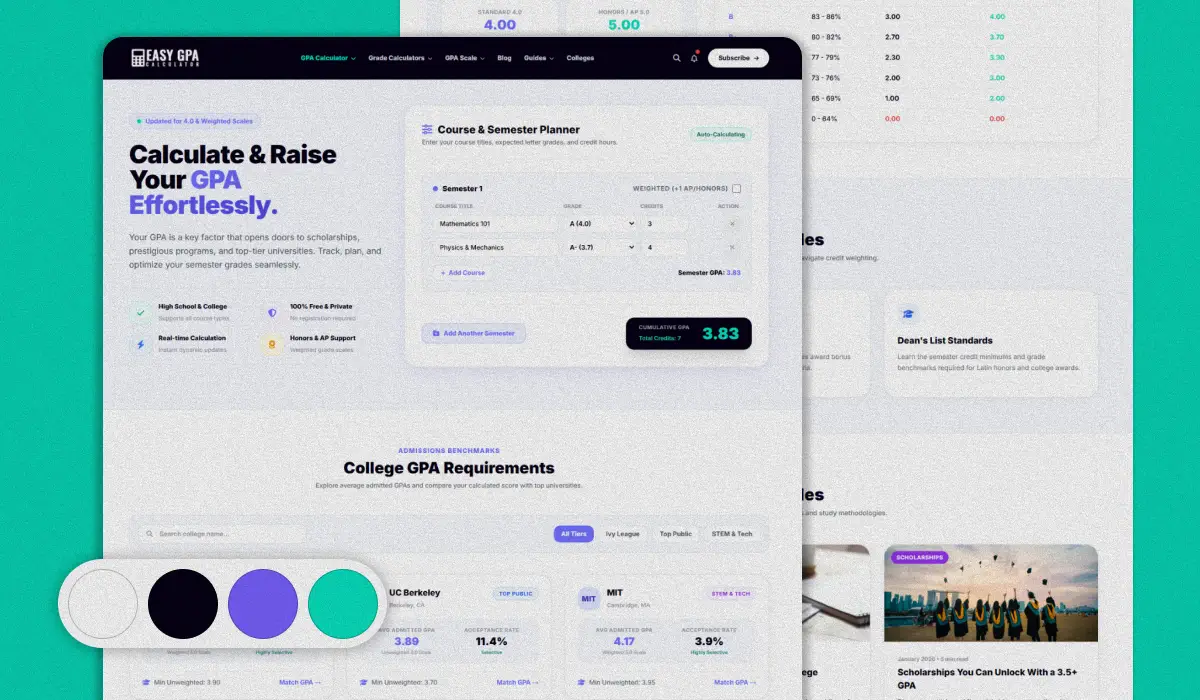
Startup calculation tool and college guide platform for students, re-engineered on WordPress with an in-memory computation engine and full programmatic SEO architecture.
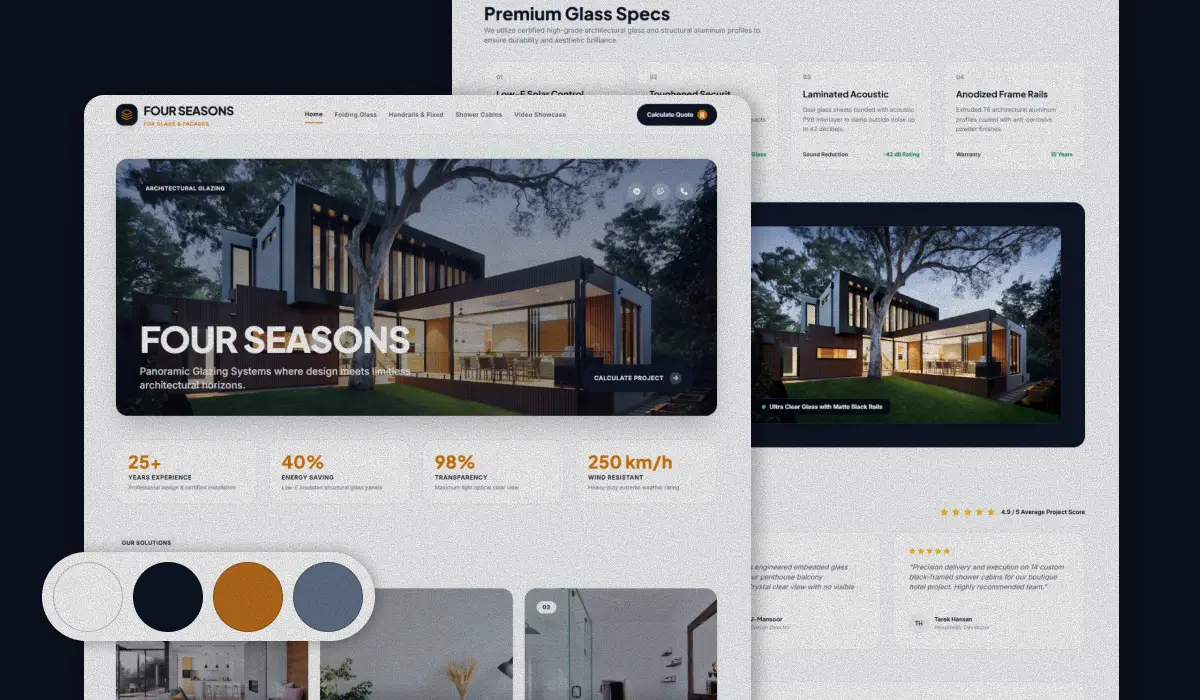
Bespoke custom WordPress platform engineered from scratch for Egypt’s premier architectural glazing fabricator, featuring next-gen WebP portfolio galleries and localized regional SEO.
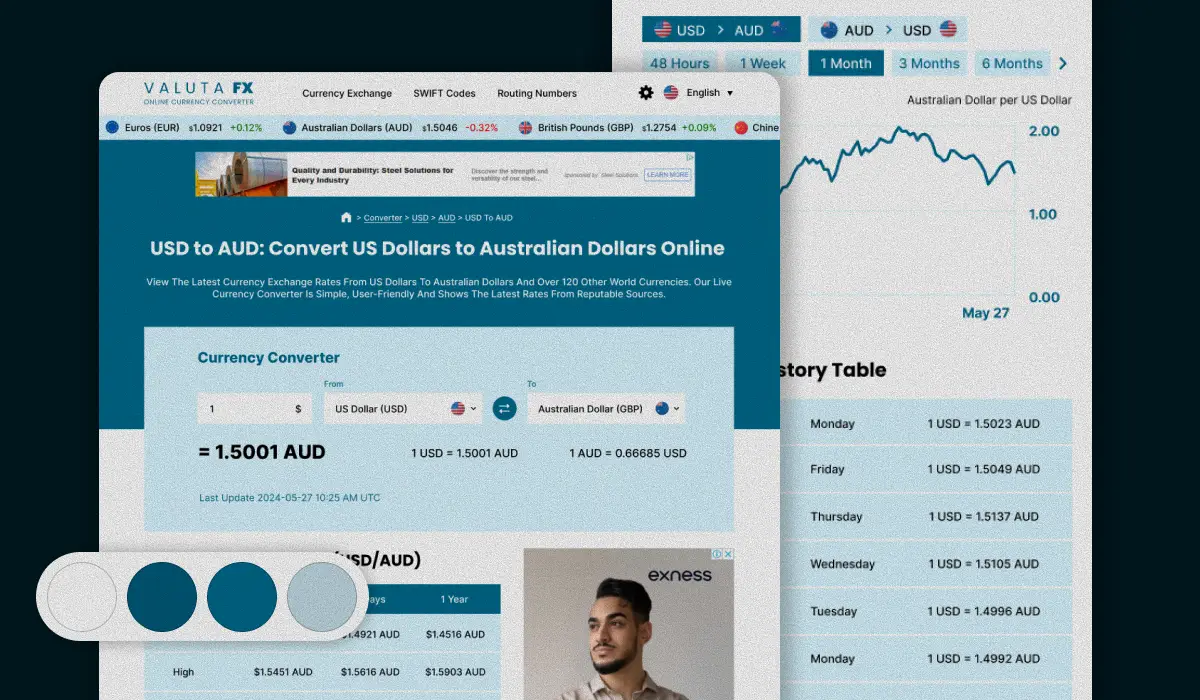
End-to-end UI/UX redesign and logo modernization for a high-traffic global currency converter, engineered with high-contrast fintech components and streamlined conversion flow.
Full digital redesign for Sydney and Illawarra's premier plumbing specialists, engineered for sub-second mobile speed, friction-free booking forms, and high-converting local outreach.
High-performance international trading portal for certified organic vegetables and fruits, featuring wholesale container specifications, EU compliance certifications, and automated B2B RFQs.
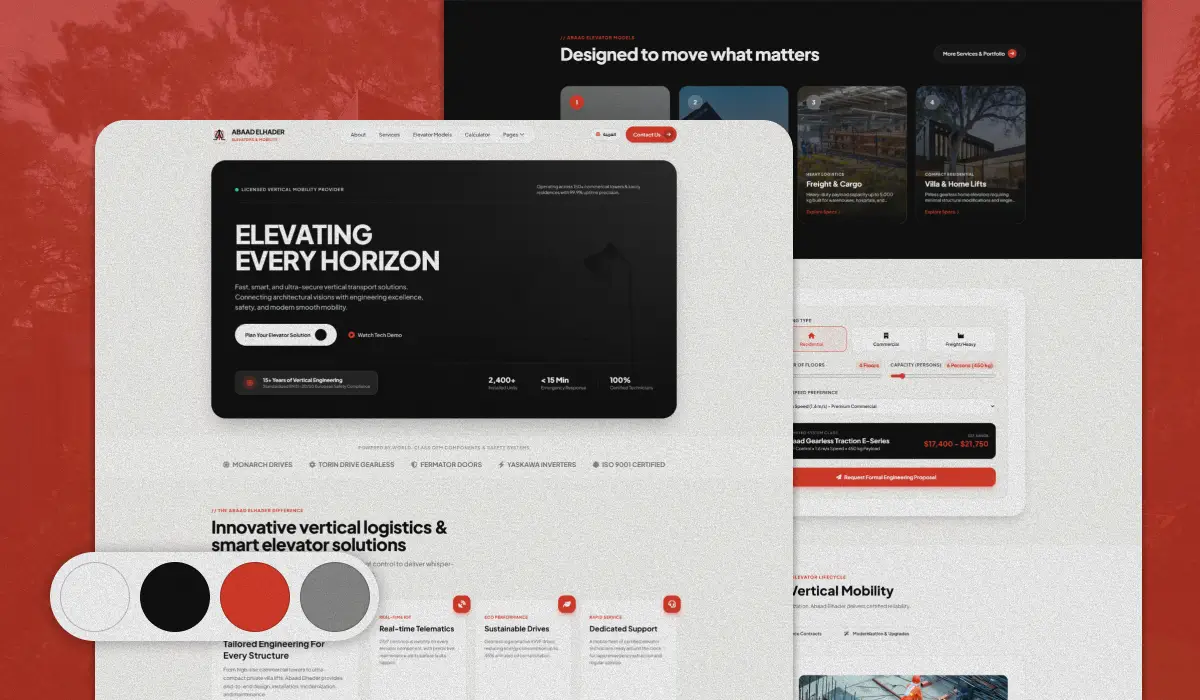
Modern corporate digital presence for an architectural elevator and mobility engineering leader, featuring interactive lift configurators, technical specifications, and luxury project showcases.
Trusted by clients who value quality and results.

"The Tunland 4x4 website has already made its first sale! We're so happy with the results. Thank you for all your help and support. Alaa did an amazing job bringing the vision and direction to life."


"Working with Code1001 made a huge difference for my clinic. The website is clean, loads fast, and patients find it very easy to book their sessions online. Alaa really listened to what we needed and delivered ahead of schedule."

"We're getting a lot of compliments on the new website, and we already received several quote requests through WhatsApp in the first week. Alaa was super helpful, patient, and delivered exactly what we asked for. Thank you so much!"

"Managing my student groups and teaching schedule used to take up hours of paperwork every week. Abdelrahman from the Code1001 team built a custom app that organized everything—classes, timings, and student tracking—in one simple place. It made my daily work so much easier. Thank you so much Abdelrahman and the Code1001 team!"

"Code1001 helped us take Step Up Academy to the next level. They created beautiful designs for our brand and automated our student registrations and daily follow-ups. What used to take hours of manual work every day now runs smoothly. Thank you so much for the wonderful work and continuous support!"
Everything you need to know about our website performance optimization process, timelines, and guarantees.
In virtually every engagement we achieve a final Lighthouse Performance score of 90 or above — typically 90–99 — on both desktop and mobile. The starting point affects the journey, not the destination. Sites scoring 20–40 see the most dramatic transformations, often jumping 60+ points within a 48–96 hour sprint. We provide a written guarantee for the performance targets agreed upon during scope definition.
No. We work on a complete staging clone of your website before touching production. All optimizations — image conversions, CSS refactoring, JS deferral, caching setup — are tested exhaustively on staging. We run visual regression tests and full cross-browser checks before deploying to your live site. Your design remains pixel-perfect; we only affect how efficiently assets are loaded.
A focused performance sprint for a standard WordPress or WooCommerce site typically takes 48–96 hours. Complex projects involving page builder decoupling, custom caching infrastructure, or large database optimization can take 1–2 weeks. We provide a clear timeline after the initial audit and never begin work without your approval on the scope and targets.
Yes — Core Web Vitals are a confirmed Google ranking signal as part of the Page Experience update. Sites that achieve green Core Web Vitals (Good LCP, Good INP, Good CLS) receive a ranking advantage over competitors with poor vitals, especially in competitive markets. Beyond direct ranking signals, faster sites produce better user engagement metrics (lower bounce rate, higher session depth), which Google interprets as quality signals that indirectly improve rankings further.
Yes. We optimize all major CMS platforms and custom-built websites including WordPress, WooCommerce, Shopify, Webflow, Magento, and Next.js/React applications. Our optimization approaches differ by platform — we apply WordPress-specific techniques (OPcache, WP Object Cache, Nginx FastCGI) while also implementing universal optimizations (image formats, CDN, critical CSS) that work across any technology stack.
Performance can degrade over time as new content, plugins, and code changes accumulate. That is why we offer optional ongoing monitoring packages that run automated daily Lighthouse tests, alert you to regressions, and include a monthly engineering hour to address any issues before they impact users or rankings. We also provide detailed documentation so your team understands performance best practices going forward.
Book a free performance audit with our speed engineering team. We will diagnose your bottlenecks, benchmark your Core Web Vitals, and deliver a prioritized action plan with guaranteed results.